
The operating point is an intersection
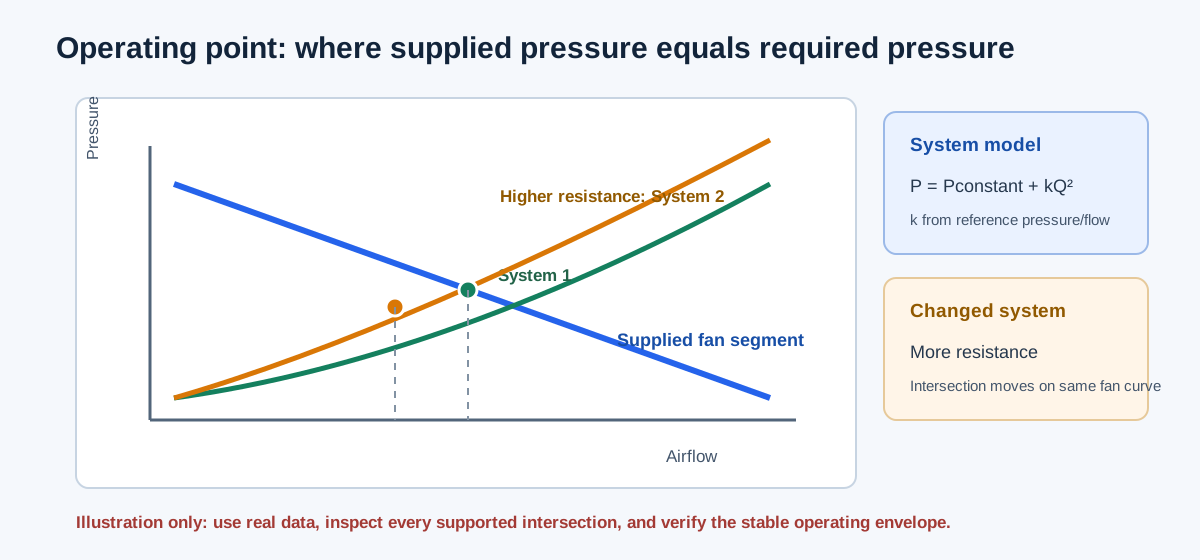
A fan curve describes pressure available as airflow changes for one fan configuration, speed, density, and pressure basis. A system curve describes pressure required by the connected system at the same airflow. Their operating point is an intersection: the fan supplies the pressure the system requires at that flow.
The Fan and System Curve Calculator uses supplied fan rows and linearly interpolates between them. It uses a quadratic flow-dependent system term plus an explicit flow-independent pressure term. It preserves every supported mathematical intersection; it does not automatically choose a stable or preferred physical point.
| Curve | Meaning | Calculator input |
|---|---|---|
| Fan curve | Pressure available from the fan at each airflow | Strictly increasing actual CFM rows with matching pressure |
| Friction term | Flow-dependent system resistance | Pressure at a reference airflow |
| Flow-independent term | Constant system pressure component | Nonnegative explicit pressure term |
| Intersection | A mathematical equality of available and required pressure | Operating flow/pressure within supplied support |
Enter one real fan curve and a matching system basis
Enter at least two fan rows with strictly increasing airflow and nonnegative pressure. Use actual manufacturer or test data for one speed, fan configuration, density, and total/static pressure definition. The synthetic examples in the form are mathematical teaching data and must not be treated as product data.
Enter System reference airflow and the friction pressure at that reference. The reference is used to define the quadratic system term; it is not assumed to be the operating point. Enter a separate flow-independent pressure term for items that do not scale as Q². In compare mode, describe the changed system condition and enter both friction and constant terms while reusing the fan curve only if fan speed, density, and configuration remain the same.
The solver does not extrapolate beyond the fan rows. A system intersection outside the supplied airflow range is withheld. Multiple intersections remain visible because the data alone do not establish which is physically stable or acceptable.
Psystem(Q) = Pconstant + Pfriction,ref × (Q/Qref)²
Operating point satisfies Pfan(Q) = Psystem(Q)
For each fan segment, solve the supplied linear Pfan against the quadratic system curve
| Basis | Match across fan/system inputs | Why |
|---|---|---|
| Airflow | Actual CFM and measurement/design state | Prevents volume-basis mixing |
| Pressure | Static or total definition | Pressure curves are not interchangeable |
| Density | Same inlet/reference state or justified correction | Fan pressure changes with air condition |
| Speed/configuration | Same fan curve configuration | Different speed requires a different curve or valid fan-law transform |
| System change | Friction/constant terms only in compare mode | Do not silently invent a filter or damper multiplier |
Use the calculator in sequence
Choose the single-curve or comparison mode, then enter at least two supplied fan points as airflow in CFM and pressure in inches of water gauge. Use strictly increasing flow rows on a consistent pressure, density, speed, and configuration basis. Enter the system reference flow, friction pressure at that flow, and the separate constant pressure term. In compare mode, enter both system scenarios against the same fan curve.
The calculation updates as values change. Review every reported intersection and its location within the supplied fan rows. Add real curve points if the intersection is unsupported; the calculator intentionally does not extend the fan curve. A plotted intersection is a mathematical solution, not a stability or equipment approval.
| Step | Form entry | Interpretation |
|---|---|---|
| 1 | Fan curve rows: CFM and in. w.g. | Measured or manufacturer points for one matching condition |
| 2 | Reference airflow and friction pressure | Defines the flow-dependent quadratic system term |
| 3 | Constant pressure term | Explicit flow-independent term, not another friction multiplier |
| 4 | Optional comparison system terms | Changed scenario; reuse the fan curve only if its condition is unchanged |
| 5 | Inspect intersections and plotted support | All supported mathematical points remain visible |
Independent synthetic operating-point example
Use the supplied synthetic fan points (0 CFM, 2 in. w.g.), (1,000, 1), and (2,000, 0). Let reference airflow be 1,000 CFM, friction pressure at that reference be 1 in. w.g., and constant pressure be zero. At Q = 1,000 CFM, fan pressure is 1 in. w.g. by the supplied row, and system pressure is 1 × (1,000/1,000)² = 1 in. w.g. Therefore the intersection is 1,000 CFM at 1 in. w.g.
The example is synthetic and only checks the intersection arithmetic. It does not represent a real fan curve, an approved pressure basis, a stable operating range, or a product selection.
Pfan(1,000) = 1 in. w.g.
Psystem(1,000) = 1 × (1,000/1,000)² = 1 in. w.g.
Intersection = 1,000 CFM at 1 in. w.g.
| Quantity | Value |
|---|---|
| Fan rows | (0, 2), (1,000, 1), (2,000, 0) |
| Reference flow | 1,000 CFM |
| System friction pressure at reference | 1 in. w.g. |
| Flow-independent pressure | 0 in. w.g. |
| Operating intersection | 1,000 CFM / 1 in. w.g. |
Independent comparison with a higher resistance curve
Keep the same synthetic fan curve. Scenario 1 uses 1 in. w.g. friction at 1,000 CFM; scenario 2 uses 2 in. w.g. friction at the same reference flow. Scenario 2 satisfies 2 − Q/1,000 = 2(Q/1,000)² on the first fan segment. Let x = Q/1,000. Then 2x² + x − 2 = 0, so the positive root is x = (−1 + √17)/4 = 0.780776406. The operating airflow is 780.776406 CFM and the system pressure is 2x² = 1.219223594 in. w.g.
Relative to scenario 1, airflow changes by −219.223594 CFM and pressure changes by +0.219223594 in. w.g. The calculator displays the same values after rounding. This is a constructed resistance comparison, not a filter, damper, or installation recommendation.
2 − x = 2x²; x = (−1 + √17)/4 = 0.780776406
Q₂ = 1,000x = 780.776406 CFM
P₂ = 2x² = 1.219223594 in. w.g.
| Scenario | Airflow | Pressure |
|---|---|---|
| 1: friction 1 at 1,000 CFM | 1,000 CFM | 1.000 in. w.g. |
| 2: friction 2 at 1,000 CFM | 780.776406 CFM | 1.219223594 in. w.g. |
| Scenario 2 minus scenario 1 | −219.223594 CFM | +0.219223594 in. w.g. |
Keep installation effects and ordinary losses separate
System-effect pressure is an additional allowance caused by installation geometry departing from the fan rating arrangement. It must use a source-matched coefficient, reference area, velocity, density, and fan configuration. Ordinary duct friction, fitting loss, filter loss, coil loss, and terminal loss still need their own accounting. Do not add a system-effect allowance if it is already included in a supplied fan curve or component loss.
A fan-system curve intersection after adding an installation effect remains a mathematical result on the supplied data. It does not prove stability, absence of stall or surge, acceptable noise, motor capacity, or field performance. If source coefficients are unavailable, retain the missing-data boundary and use a curve that actually includes the installation condition.
| Check | Question | Separate evidence |
|---|---|---|
| Curve basis | Is the fan curve total or static pressure? | Matching fan test/rating data |
| System accounting | Were filters, coils, fittings, and system effect counted once? | Complete pressure budget with boundaries |
| Mechanical limits | Is speed, shaft power, motor, drive, and control range acceptable? | Equipment ratings and controls |
| Operating stability | Is the intersection in a valid stable region? | Manufacturer operating envelope and field behavior |
| Changed condition | Does the comparison alter only system resistance? | Measured or documented changed-system data |
FAQs
Why does the fan curve need more than one row? The calculator linearly interpolates only between supplied points, so at least two strictly increasing airflow values are needed to define supported segments.
Does a higher resistance always produce one lower-flow operating point? The example shows that result for a monotonically decreasing fan segment and a quadratic system curve, but supplied curves can cross multiple times or have no supported intersection. The tool reports the mathematics instead of selecting a preferred point.
Can system effect be entered as ordinary friction? No. Installation-effect allowance requires applicable geometry and source data and must not duplicate losses already represented in the curve or component accounting. A real equipment assessment also needs the manufacturer operating envelope and system evidence.
Conclusion and limits
Use the calculator to find supported mathematical intersections from supplied fan and system data. Keep the fan curve, pressure basis, density, speed, system resistance, and installation effects explicit. A curve chart can reveal a changed operating point; it cannot validate the fan, the system model, or the installation by itself.
The cited ASHRAE and Greenheck materials provide the fan/system and installation-effect context. Product-specific coefficients and performance data remain required for a real equipment decision.