
Balancing starts with a valid measurement schedule
A balancing comparison is only meaningful when design and measured airflow use compatible references, the readings describe one stated operating condition, and every terminal belongs to an independently established balancing group. The workbench does not infer group membership from room names, correct density, or predict what a damper adjustment will do.
The terminal schedule mode reports several separate questions: whether each terminal lies within the selected design band, whether each group total lies within its selected total band, and whether the group’s terminal ratios are close to the lowest measured/design ratio. The retained supply/return mode only compares two total flows at one stated boundary.
| Check | Calculation | Interpretation |
|---|---|---|
| Terminal design band | Measured CFM ÷ design CFM | Whether an individual terminal is within selected lower/upper bounds |
| Group total band | Group measured total ÷ group design total | Whether the group total is within its separate selected tolerance |
| Group index | Lowest terminal ratio in that group | The lowest measured/design ratio; all ties are retained |
| Proportional reference | Terminal design CFM × group index | A fixed-snapshot comparison reference, not a predicted adjusted flow |
| Proportional spread | 100 × (ratio/index − 1) | Relative spread above the lowest ratio |
Enter the schedule and selected criteria
Choose the terminal schedule mode, confirm the measurement and design reference basis, and enter one row per actual terminal: unique ID, independently established group ID, positive design CFM, and nonnegative measured CFM. Enter the selected design shortfall and excess allowances, group-total tolerance, and proportional-spread allowance as percentages. These are procedure inputs, not universal TAB tolerances.
Use the total supply/return mode only when supply and return CFM share a compatible boundary and operating condition. A difference can result from outdoor air, exhaust, transfer, leakage, or measurement boundaries; the simple comparison does not predict room pressure or prove a complete mass balance.
Run the calculation before deciding what to adjust. The output retains all lowest-ratio ties and labels proportional excess, but it does not issue damper commands, select fan speed, infer pressure loss, or estimate post-adjustment readings. Adjust under the governing field procedure and remeasure the same schedule.
| Input | Requirement | Do not infer |
|---|---|---|
| Design flow | Source and state documented for each terminal | A design value from another operating condition |
| Measured flow | Instrument/procedure correction and same stated condition | A missing terminal or zero from an omitted reading |
| Group ID | Actual balancing group established from topology/procedure | Automatic grouping by room or supply/return label |
| Criteria | Selected lower/upper, group-total, and spread limits | A universal tolerance from the calculator |
Independent terminal and group example
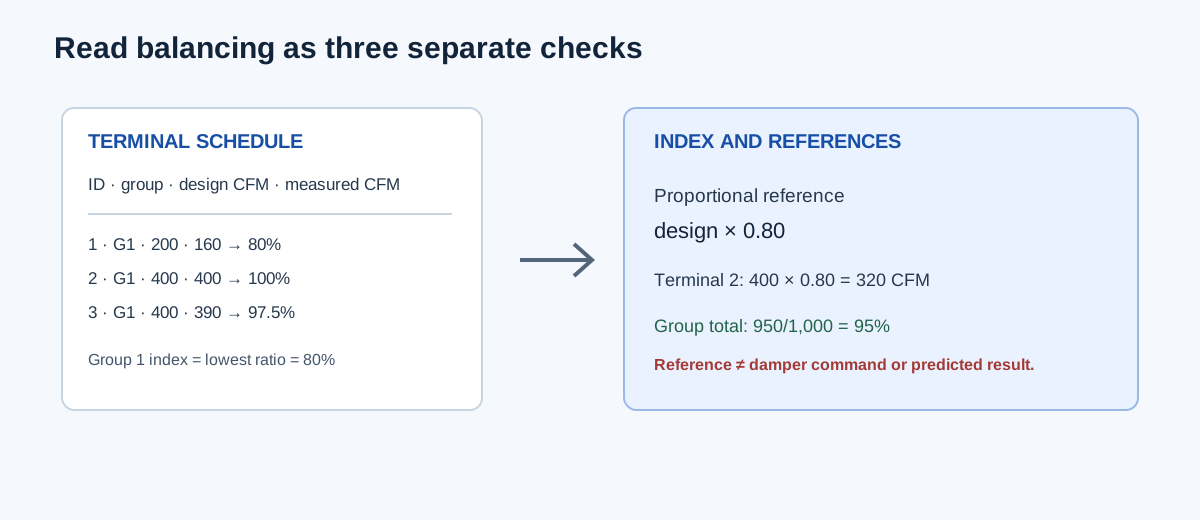
Use Group 1 design flows 200, 400, and 400 CFM with measured flows 160, 400, and 390 CFM. The ratios are 0.80, 1.00, and 0.975. With a selected ±10% design band, terminal 1 is outside while terminals 2 and 3 are inside. The group design total is 1,000 CFM and the measured total is 950 CFM, so the group total is 95.0%, exactly at the lower edge of a selected ±5% group-total band.
The group index is 0.80. Proportional references are design × 0.80: 160, 320, and 320 CFM. The measured-minus-reference differences are 0, 80, and 70 CFM. Group 1 proportional spread is 100 × (1.00/0.80 − 1) = 25.0%, so it fails a selected 5% spread even though two terminals meet the design band and the group total sits at its selected lower edge.
Group 2 has design 300/300 and measured 330/330 CFM. Both ratios are 1.10, both terminals tie as index terminals, the group total is 110% and fails the selected ±5% group-total band, while its proportional spread is 0%. This shows why a good proportional match does not prove the group total is acceptable.
Group 1 index = min(0.80, 1.00, 0.975) = 0.80
Terminal 2 proportional reference = 400 × 0.80 = 320 CFM
Terminal 3 proportional reference = 400 × 0.80 = 320 CFM
Group 1 spread = (1.00/0.80 − 1) × 100 = 25.0%
| Result | Independent value | Calculator display |
|---|---|---|
| Group 1 measured total | 160 + 400 + 390 = 950 CFM | 950 CFM |
| Group 1 total percent | 950/1,000 × 100 = 95.0% | 95.0% |
| Group 1 index | 0.80 | 0.80 |
| Terminal 2 proportional reference | 400 × 0.80 = 320 CFM | 320 CFM |
| Group 1 largest proportional excess | 25.0% | 25.0% |
| Group 2 proportional spread | 1.10/1.10 − 1 = 0% | 0% |
Use the result to plan the next measurement
Start with the governing selected criterion and the terminal/group that fails it. Check the measurement setup, instrument correction, damper/control state, branch path, and pressure conditions before changing hardware. A terminal below design may be caused by a restriction or reference error; a terminal above design may affect other branches after adjustment.
After an adjustment, repeat the complete affected schedule under the same stated condition. Recalculate the ratios, group totals, index ties, and spread. Do not carry old proportional references forward as a target instruction, because changing one terminal changes the distribution available to the others.
| Outcome | What it says | What it does not say |
|---|---|---|
| Terminal outside design band | One measured/design ratio fails the selected range | The cause or required damper movement |
| Group total fails | The group sum fails its selected total criterion | That every terminal in the group is wrong in the same way |
| Spread fails | Terminal ratios are too far apart relative to the lowest ratio | The group needs a specific adjustment sequence |
| All checks pass | Entered snapshot meets selected arithmetic criteria | Final commissioning, pressure, noise, or code approval |
FAQs
Why can a group total pass while a terminal fails? A high terminal and a low terminal can offset in the sum. Review individual ratios and the group total separately.
Why can proportional spread pass while the group is above design? If every terminal is 110% of design, their ratios are equal and spread is zero, but the group total is still 110%.
Does the index terminal tell me which damper to close? No. It identifies the lowest measured/design ratio in the supplied snapshot. Adjustment order and control response require the actual procedure and field evidence.
Conclusion and limits
Collect a complete simultaneous schedule, establish groups and compatible flow references, then read terminal design bands, group totals, and proportional spread as separate checks. After any adjustment, repeat the measurements under the same condition.
The workbench is a transparent arithmetic aid for the supplied snapshot. It does not calculate density corrections, pressure, leakage, damper commands, fan response, ventilation minimums, or final commissioning acceptance.